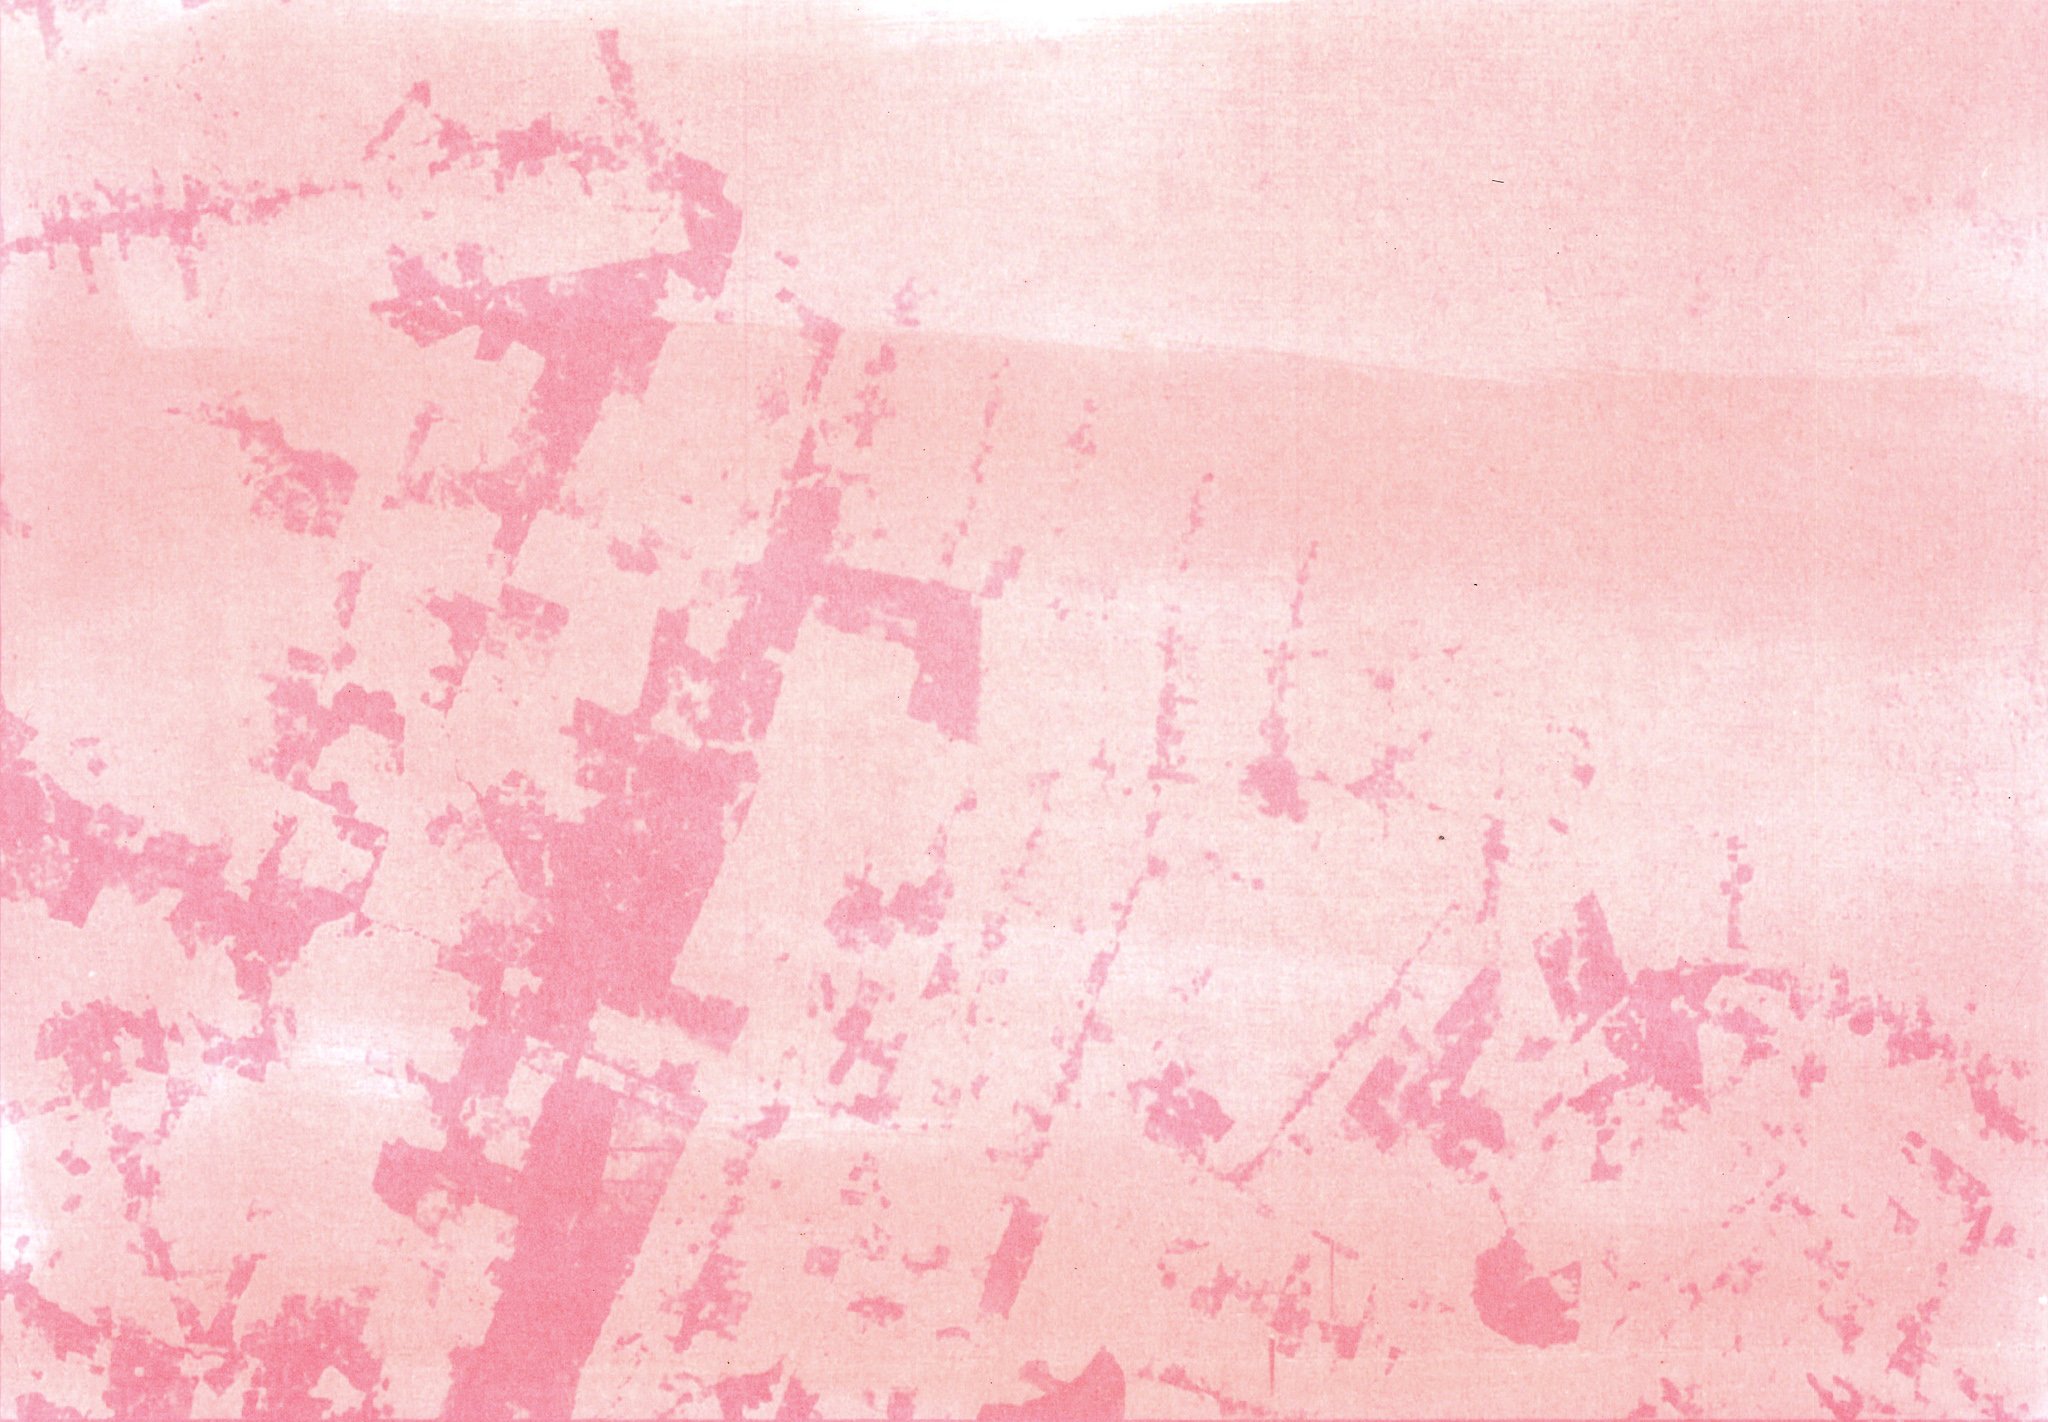
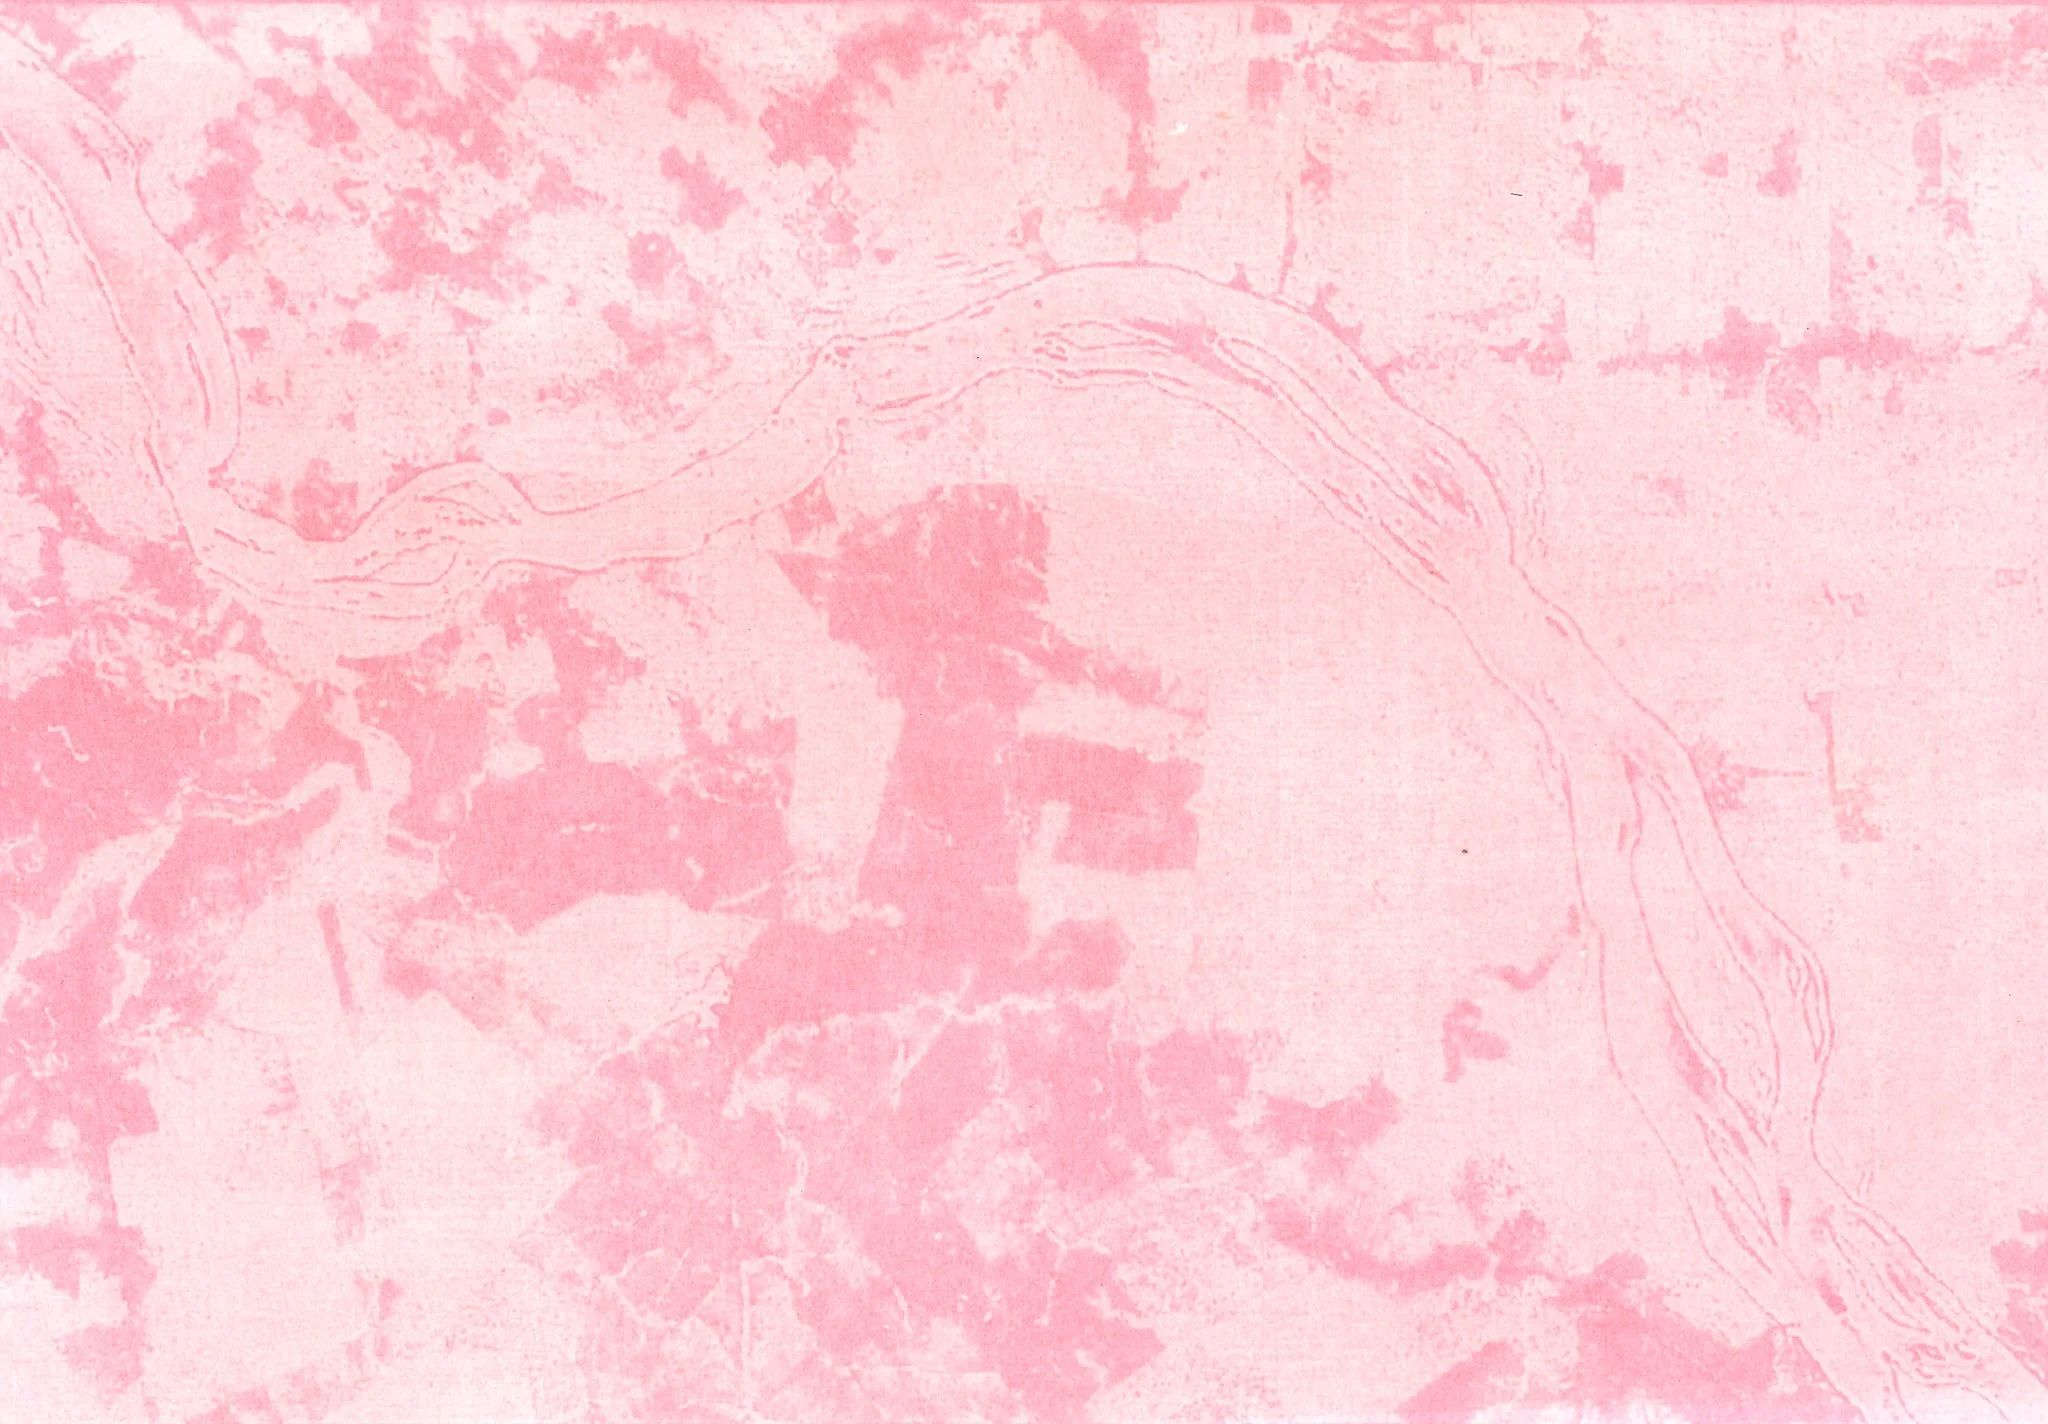
Tipping Point, 2021
Red sun prints, satellite images of the Amazon rainforest
The areas were selected based on the greater loss of forest cover and identified using the Global Forest Watch tool. To demonstrate the changes through time, the satellite images were taken from Google Timelapse in the following years 2020, 2011, 2002, 1993, e 1984.
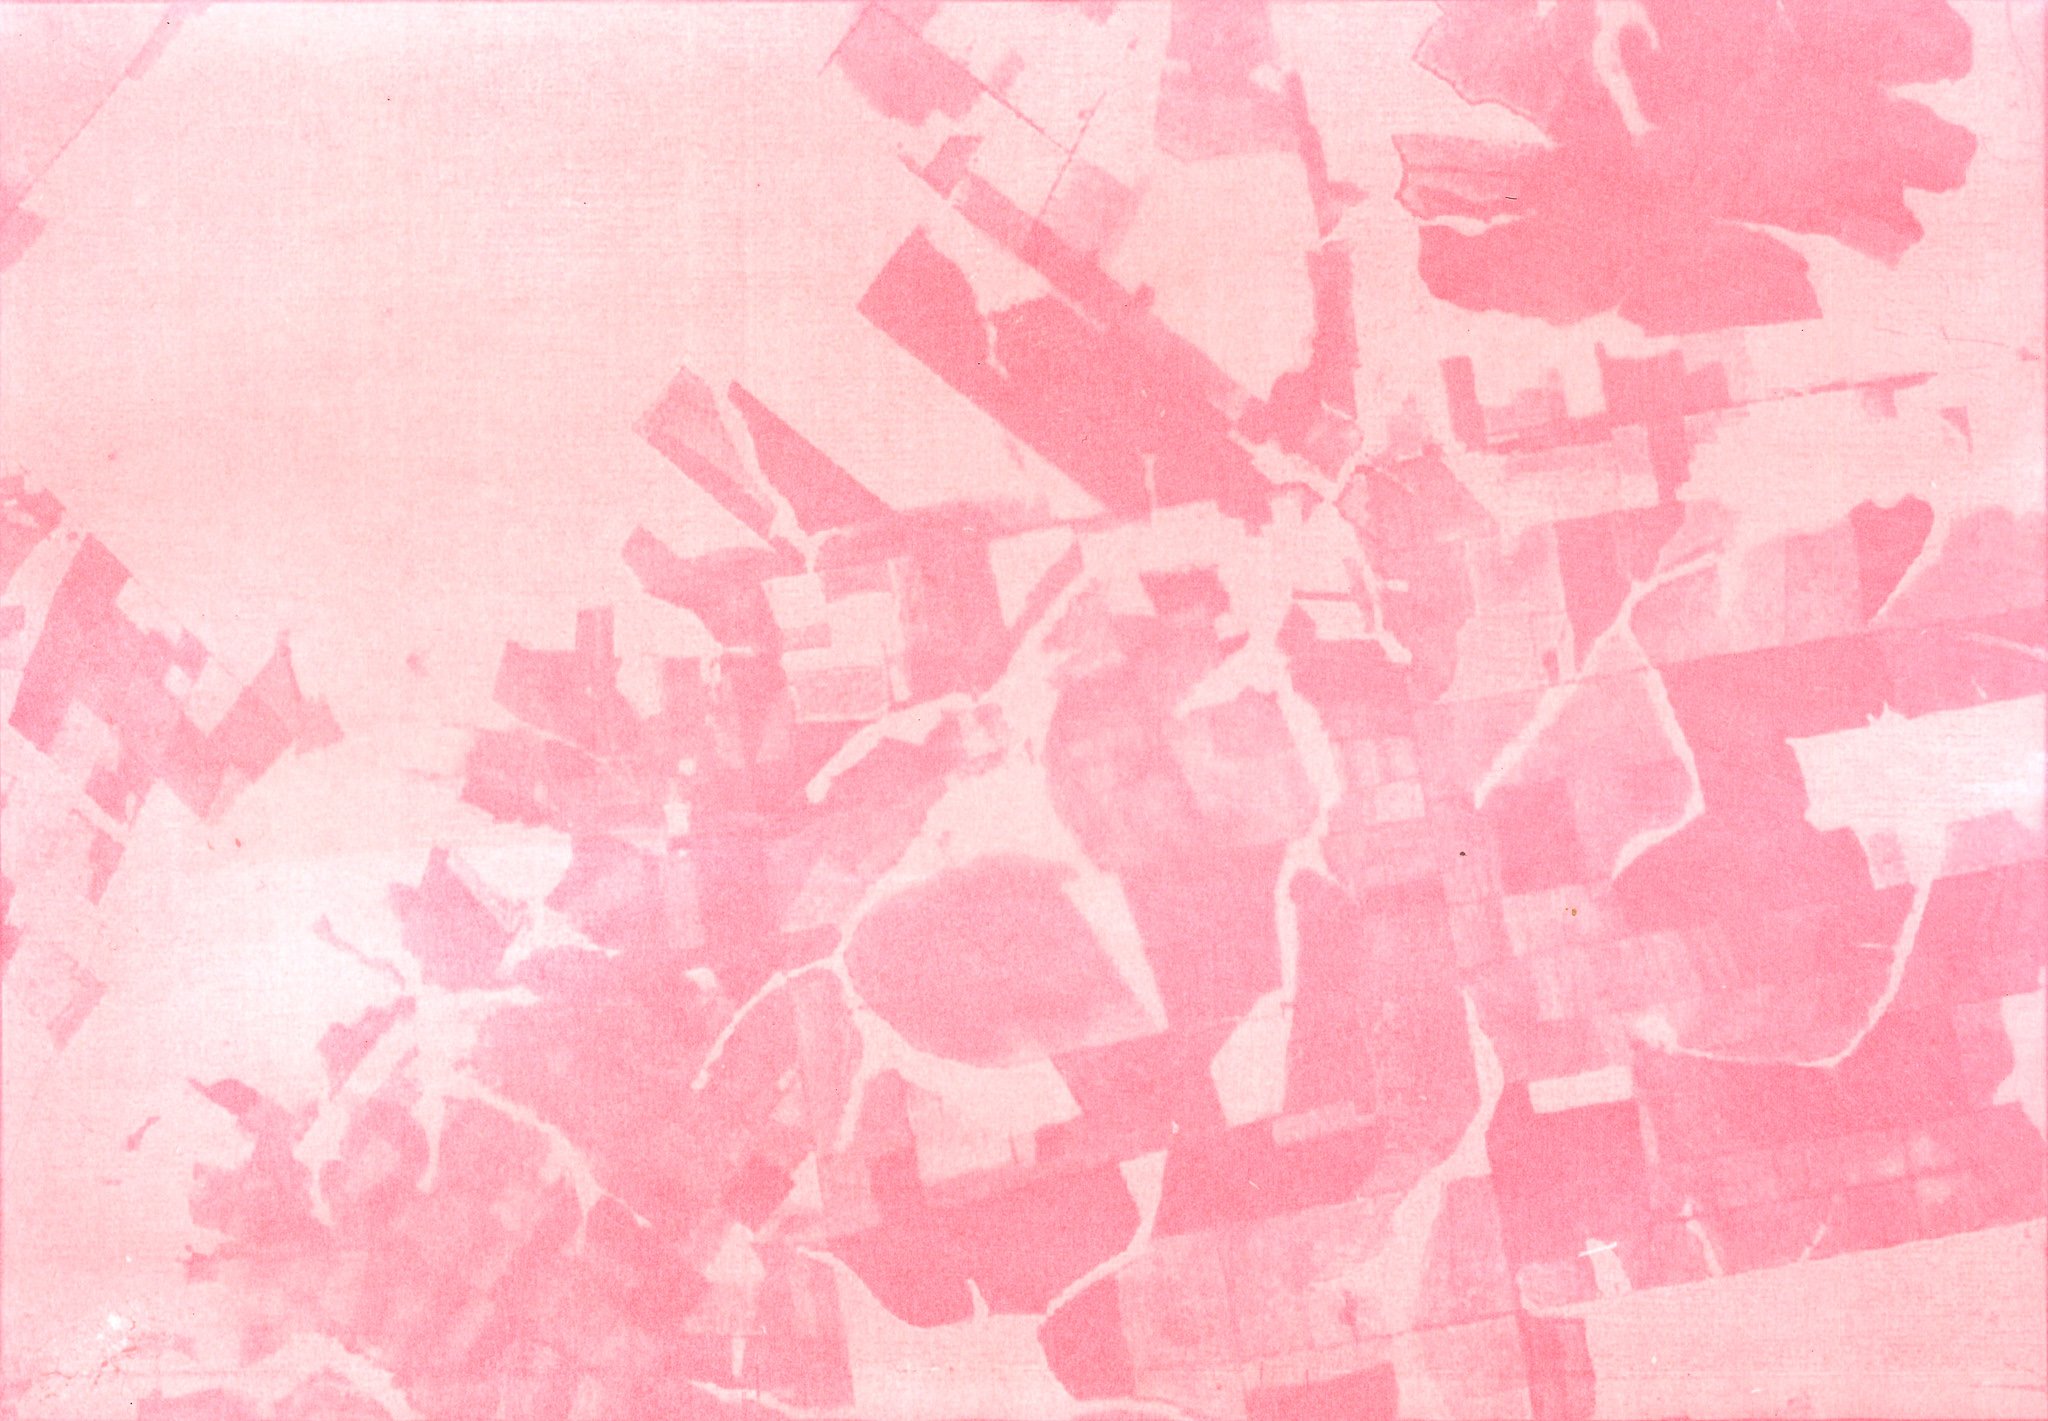
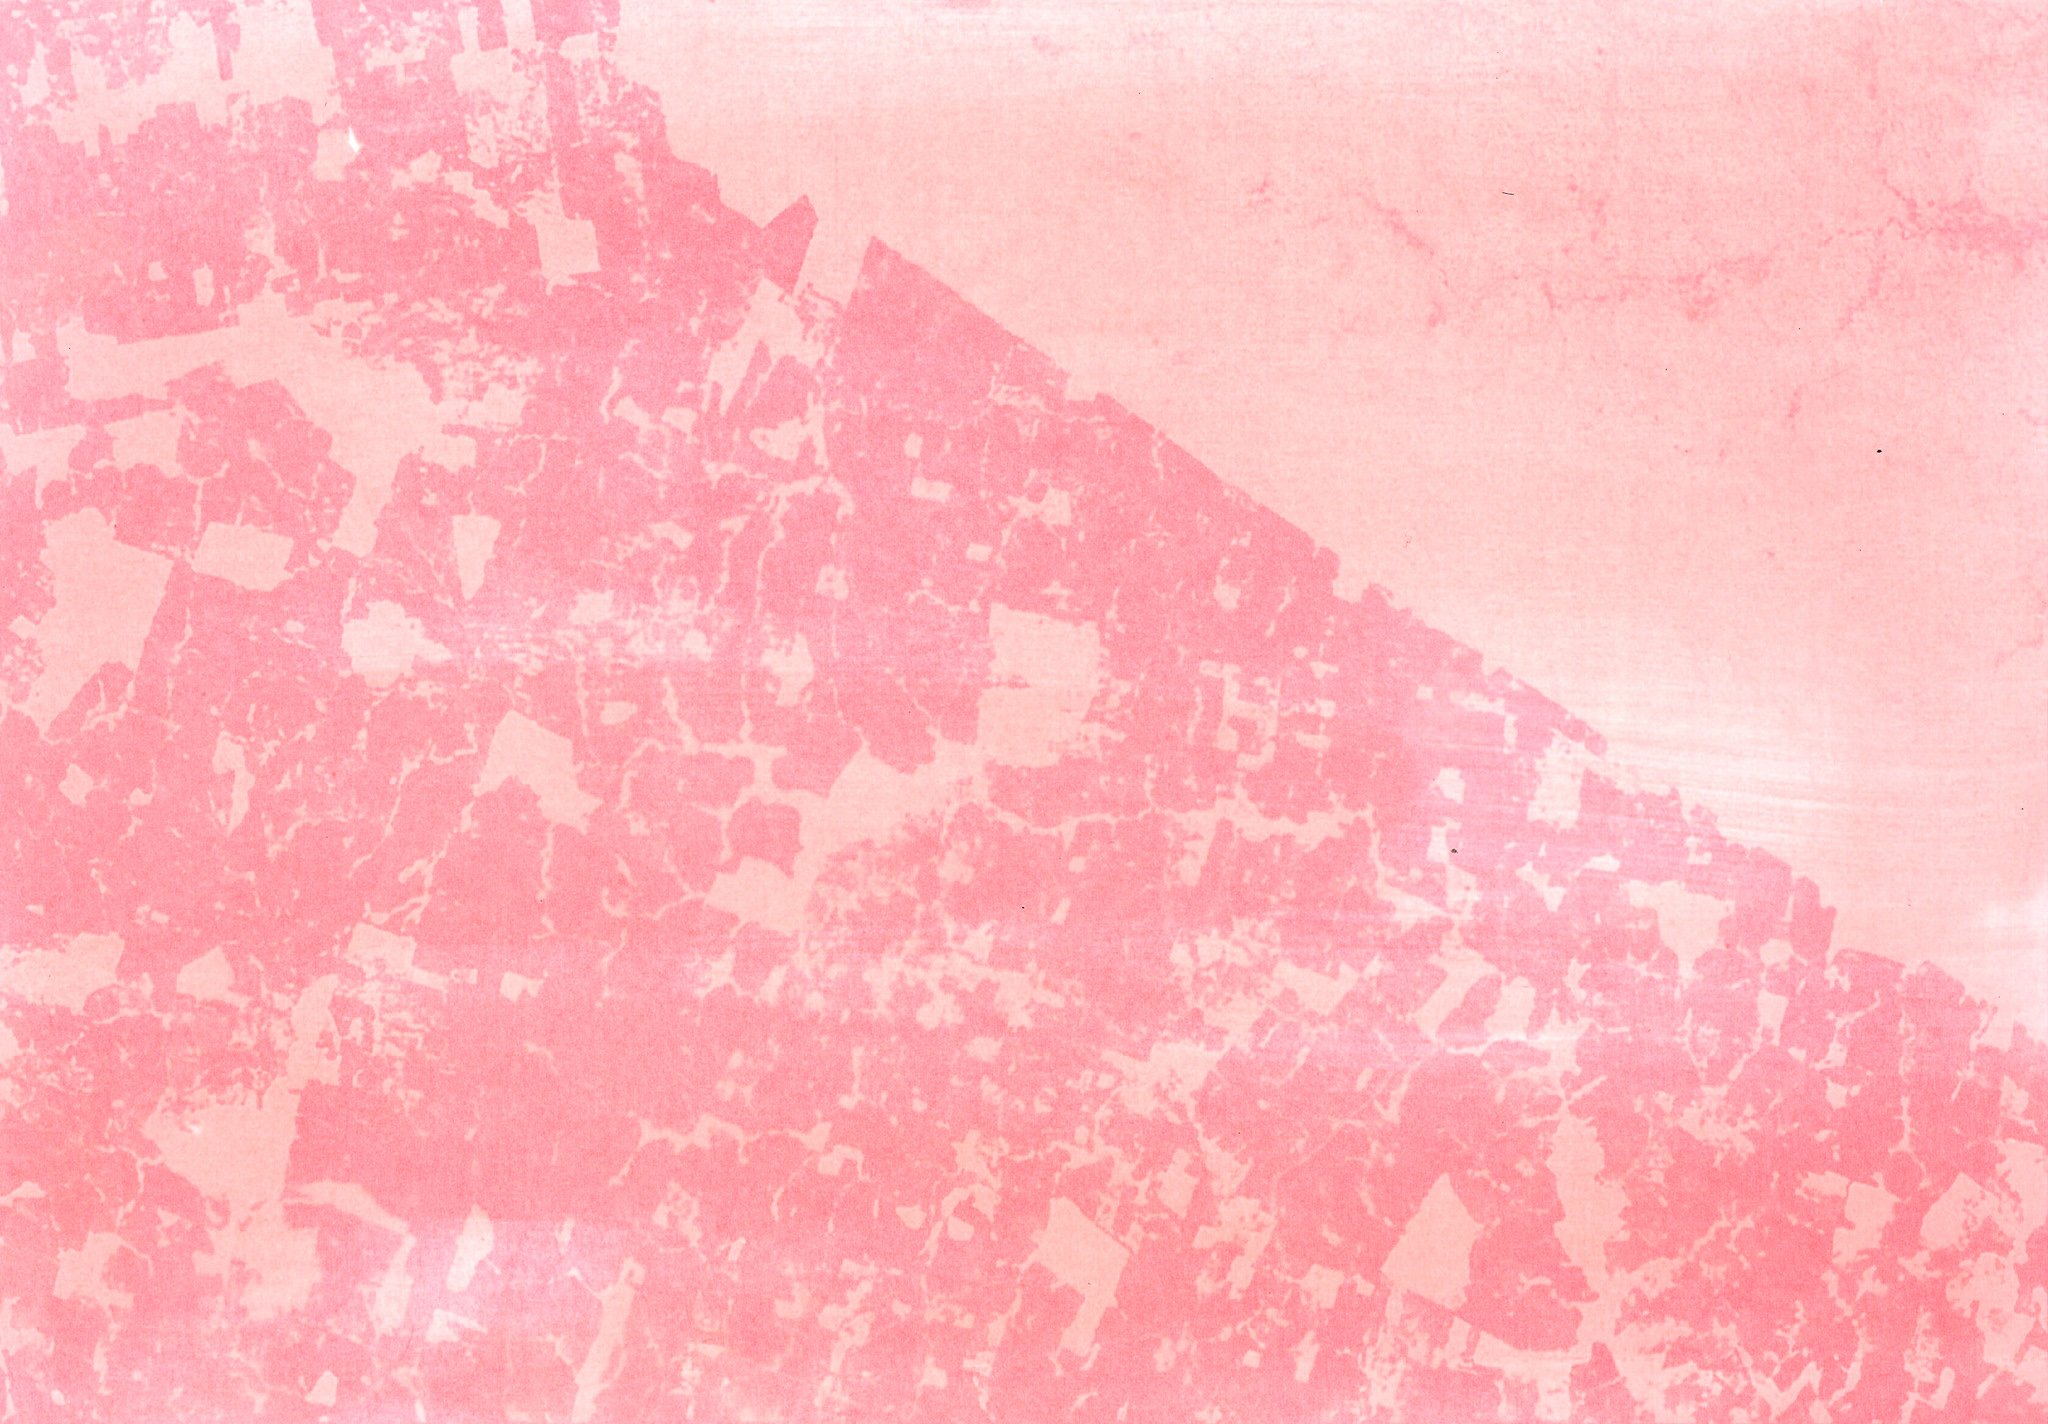
The darker color indicates the extent of deforestation.
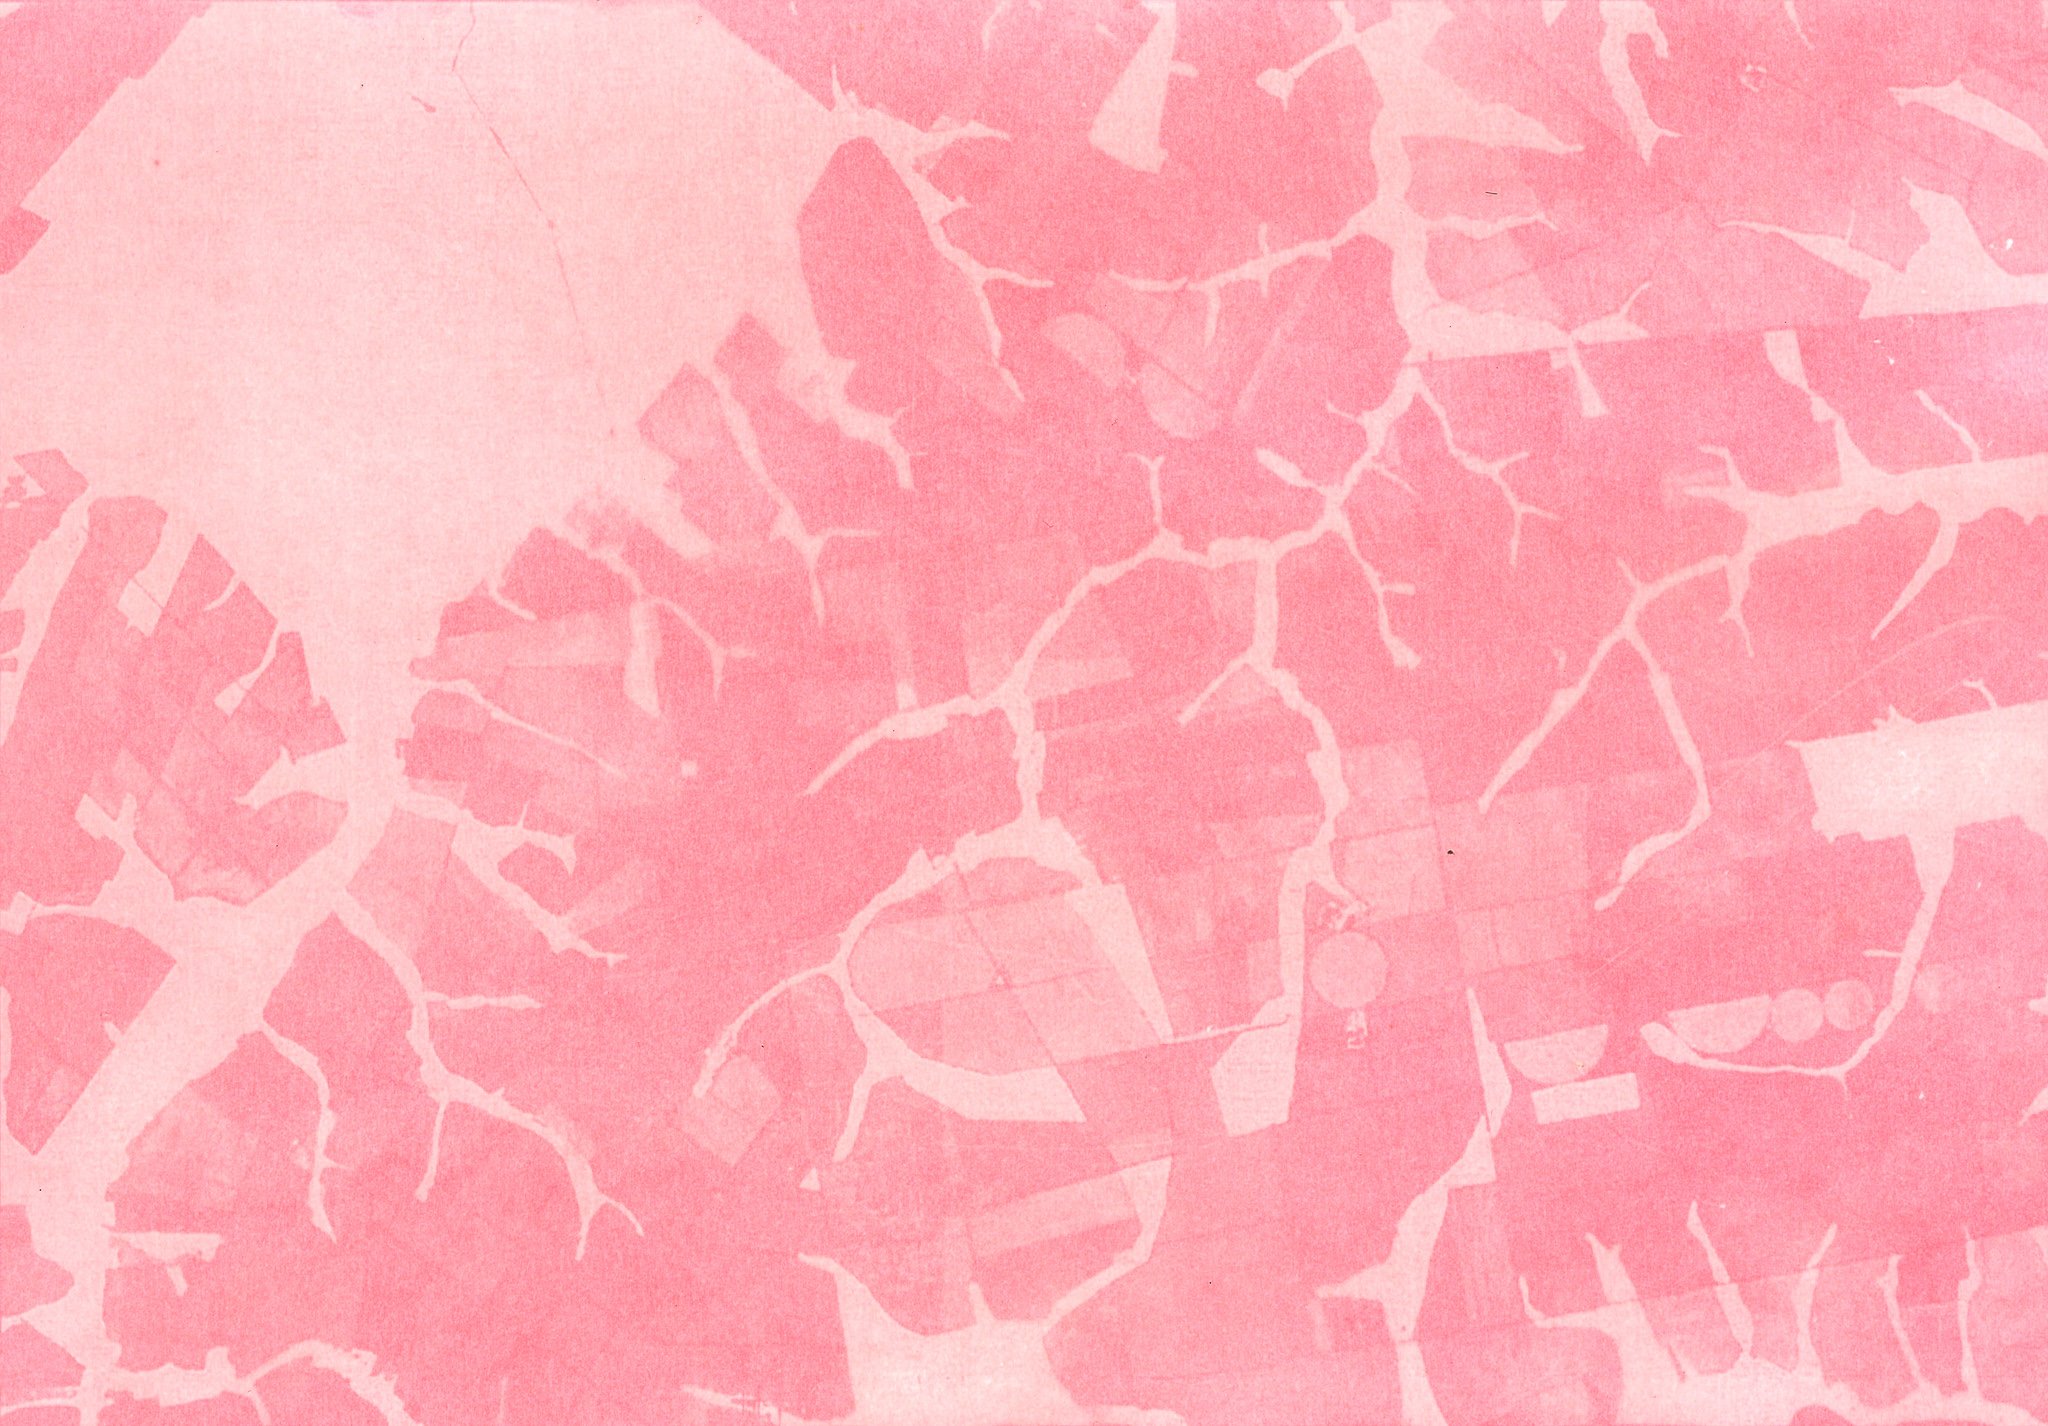
2020 - 12° 06' 09.9" S / 56° 02' 39.6" W

2011 - 12° 06' 09.9" S / 56° 02' 39.6" W
2002 - 12° 06' 09.9" S / 56° 02' 39.6" W

1993 - 12° 06' 09.9" S / 56° 02' 39.6" W
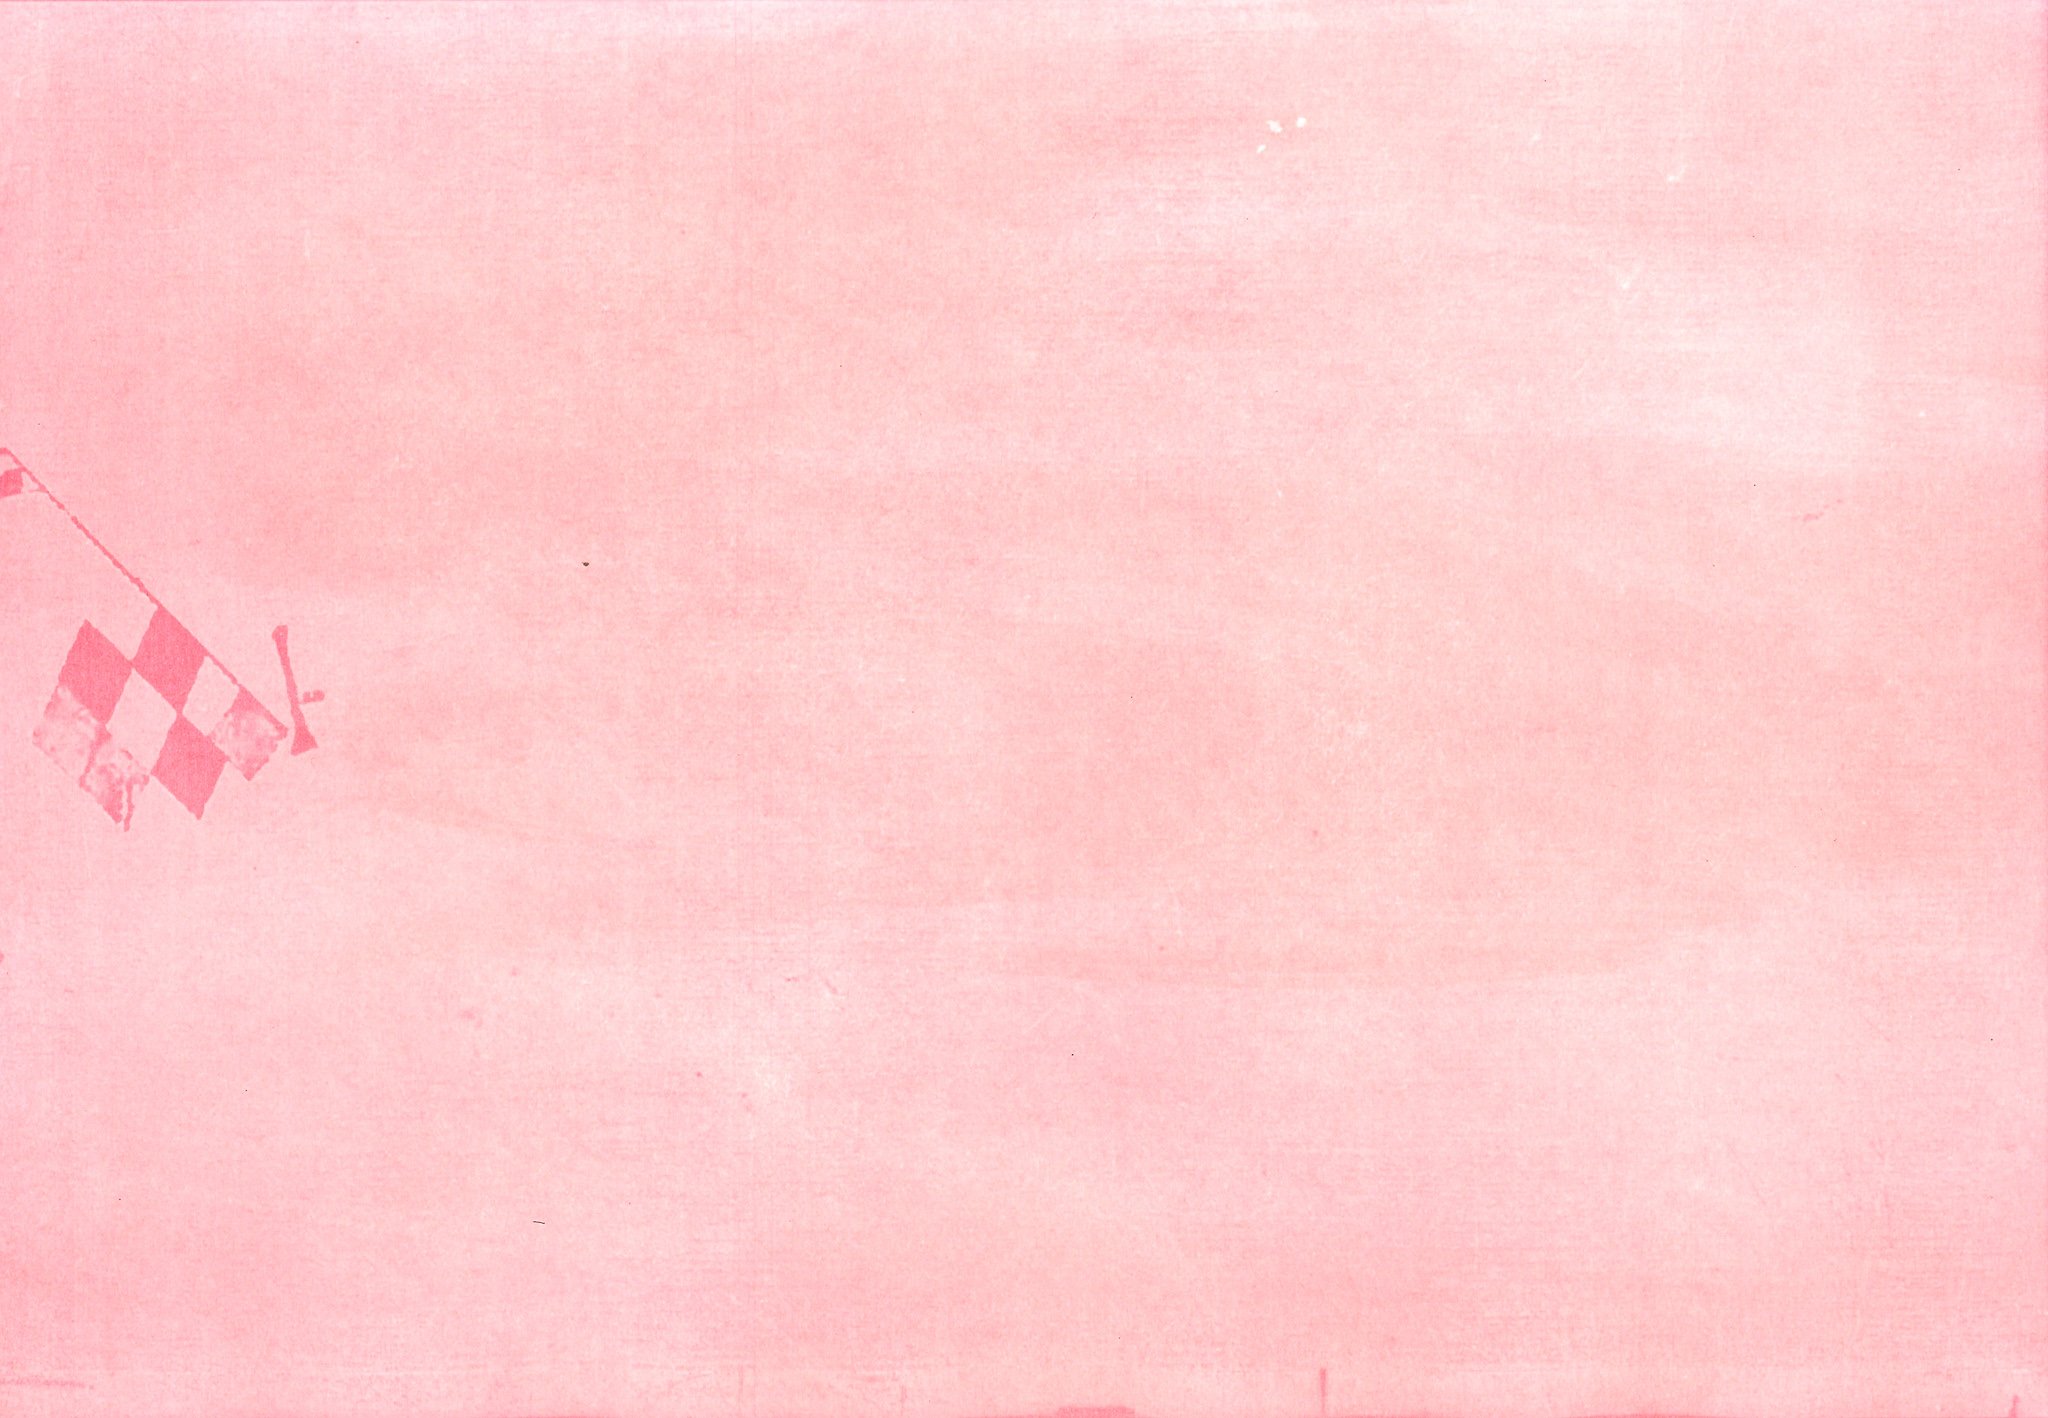
1984 - 12° 06' 09.9" S / 56° 02' 39.6" W
2022 - 5°06'57.6"S /5 0°21'02.6"W

20112022 - 5°06'57.6"S /5 0°21'02.6"W
2022 - 5°06'57.6"S /5 0°21'02.6"W

1993 - 5°06'57.6"S /5 0°21'02.6"W
1984- 5°06'57.6"S /5 0°21'02.6"W

2020 - 6° 31' 30.4" S / 52° 11' 56.7" W

2011 - 6° 31' 30.4" S / 52° 11' 56.7" W
2002 - 6° 31' 30.4" S / 52° 11' 56.7" W
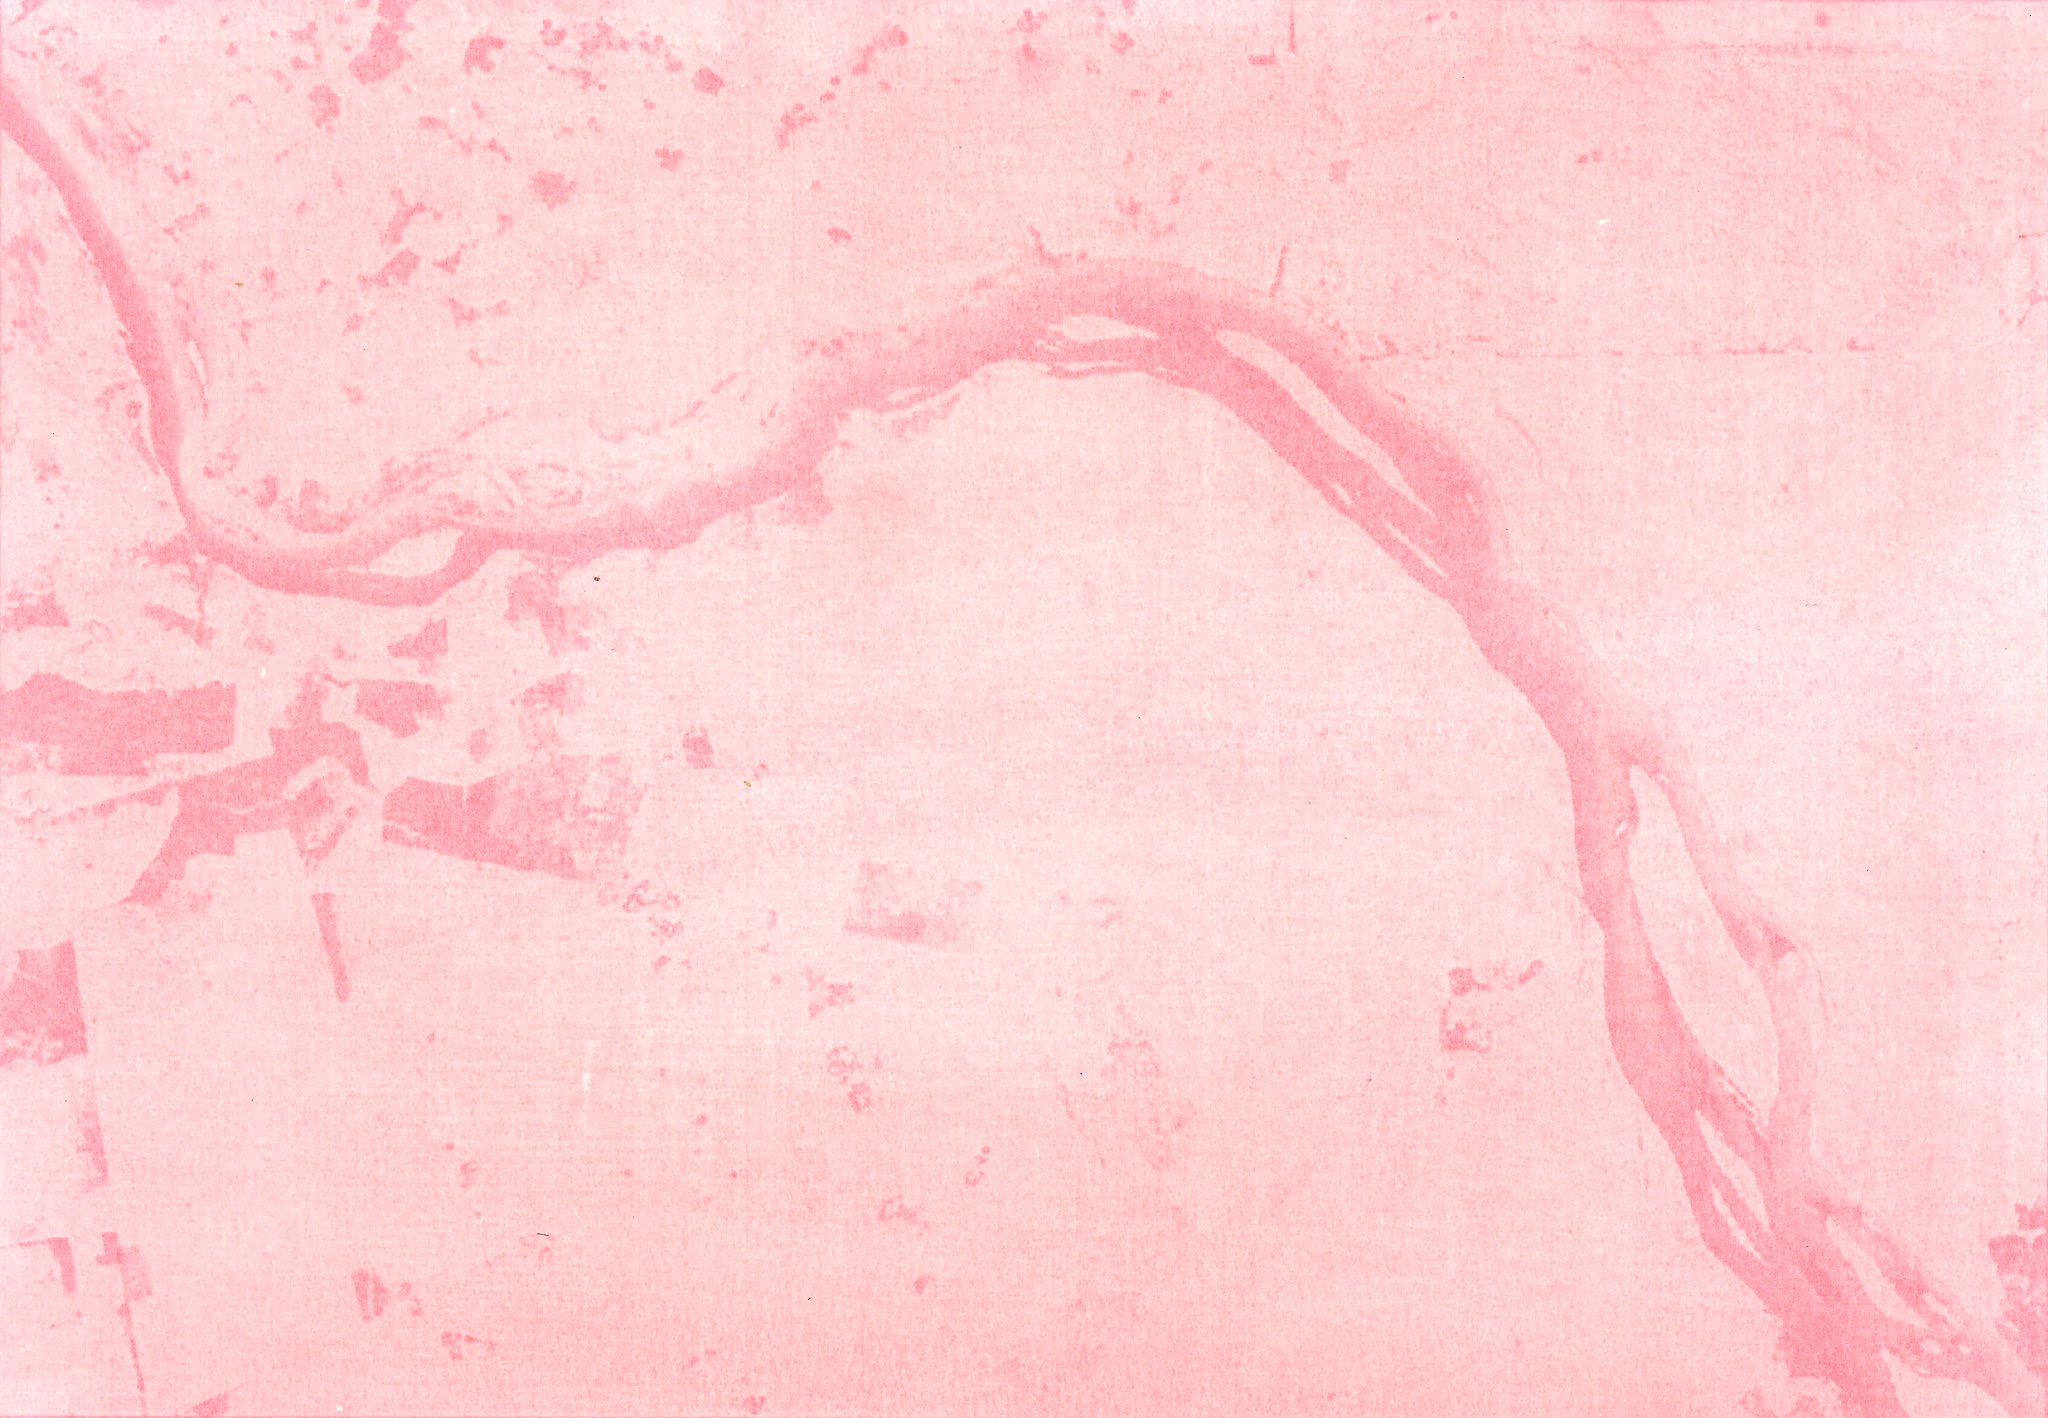
1993 - 6° 31' 30.4" S / 52° 11' 56.7" W
1984 - 6° 31' 30.4" S / 52° 11' 56.7" W